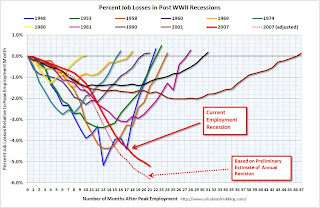
And, then, they revised the data.

There are two scary things in this chart.
One is how deep goes the employment loss in the current recession.
The other is how prolonged was the job loss in the previous recession.
The long rot of the structure of the American economy is showing, here, in collapse.
Shall I continue?
Consider this item from theNYTimes.com: "Despite signs that the economy has resumed growing, unemployed Americans now confront a job market that is bleaker than ever in the current recession, and employment prospects are still getting worse. Job seekers now outnumber openings six to one . . . "
And This! NYTimes.com:
"The recession has hit middle-income and poor families hardest, widening the economic gap between the richest and poorest Americans as rippling job layoffs ravaged household budgets.
The wealthiest 10 percent of Americans -- those making more than $138,000 each year -- earned 11.4 times the roughly $12,000 made by those living near or below the poverty line in 2008, according to newly released census figures. That ratio was an increase from 11.2 in 2007 and the previous high of 11.22 in 2003.
Household income declined across all groups, but at sharper percentage levels for middle-income and poor Americans. Median income fell last year from $52,163 to $50,303, wiping out a decade's worth of gains to hit the lowest level since 1997.
Poverty jumped sharply to 13.2 percent, an 11-year high."
No comments:
Post a Comment